
Near Zero

Near-zero scenarios for Belgium – Options and impact
Setting the scene
Reaching near-zero emissions in Belgium—and across the EU—is widely seen as essential for protecting the climate, maintaining Europe’s competitiveness, and ensuring long-term energy security. Yet scepticism towards deep decarbonization often stems from concerns about its economic feasibility, technological maturity, and potential side effects on energy security and jobs in energy-intensive, industrialized regions such as Belgium.
More specifically, there is a growing concern among European industrials that high climate ambitions in Europe will result in relocation of industrial activities to regions with less stringent climate targets. Regions like USA and China support lower climate ambitions and have access to more cost-effective fossil fuels and, depending on the region, more favourable renewable potentials.
To meet these concerns, the 2040 EU’s emission targets can be supported by a limited flexibility mechanism that allows the use of high-integrity credits from global carbon markets. The details of this flexibility mechanism under Article 6 of the Paris Agreement and the impact on the ETS system still need to be worked out this year. The European Climate Law stipulates however that the net-zero 2050 target applies only within the EU, with flexibility options limited to natural carbon sinks such as land and wetlands in EU member states. In this PATHS2050 deep-dive, we examine the impact of near-zero CO2 emission scenarios on the system costs, sectoral processes as well as energy independency.
Key questions
All three main scenarios of the PATHS2050 2025-edition reach ‘net-zero CO2 emissions’ by 2050 in Belgium, with the assumption of maintaining industrial production levels as before the COVID-19 and 2022 energy crisis. As emission reductions deepen, investment needs increase, especially for the final million tons of emissions to be abated (for reference, 1 Mt CO₂ corresponds to about 0.8% of Belgium’s 1990 emissions). This triggers a key question: How would introducing greater flexibility mechanisms and carbon markets affect the Belgian energy system, sectoral impacts, and associated costs—if Belgium pursues net-zero targets with the support of these tools, rather than strictly adhering to territorial net-zero emissions? In other words, Belgium would achieve high levels of domestic decarbonization, while covering the “last mile” through less costly alternatives, thereby reducing system costs and easing pressure on hard-to-abate sectors. In this context, Belgium would maintain its commitment to the EU-wide net-zero goal but would leverage flexible approaches.
This study does not aim to put forward any advice as to which level of Belgian climate reduction is most likely or desirable. In general, setting climate ambitions and developing the corresponding regulatory framework −such as flexibilities on global carbon markets− are the responsibility of policymakers. The aim of this study is to quantify the trade-off between energy system costs and climate ambition of near-zero CO2 emission scenarios in Belgium. In addition, we discuss in detail the underlying processes on a sectoral level, focusing on whether deep CO2 emission reductions become increasingly costly toward the final stages.
Rationale of the scenarios
To quantify the costs of deep emission reductions, the three main scenarios, ROTORS, REACTORS, and IMPORTS, were subjected to variable CO2 price trajectories towards 2050, where the CO₂ price is the main and only driver of emissions reduction. Unlike PATHS Edition 2025's main scenarios, there is no preset net-zero decarbonisation level in 2050. The CO2 price in 2050 was varied between 100€/ton and a very high 1100€/ton, yielding different levels of emission reductions and system costs. More details on the methodology are given in the Annex.
Results
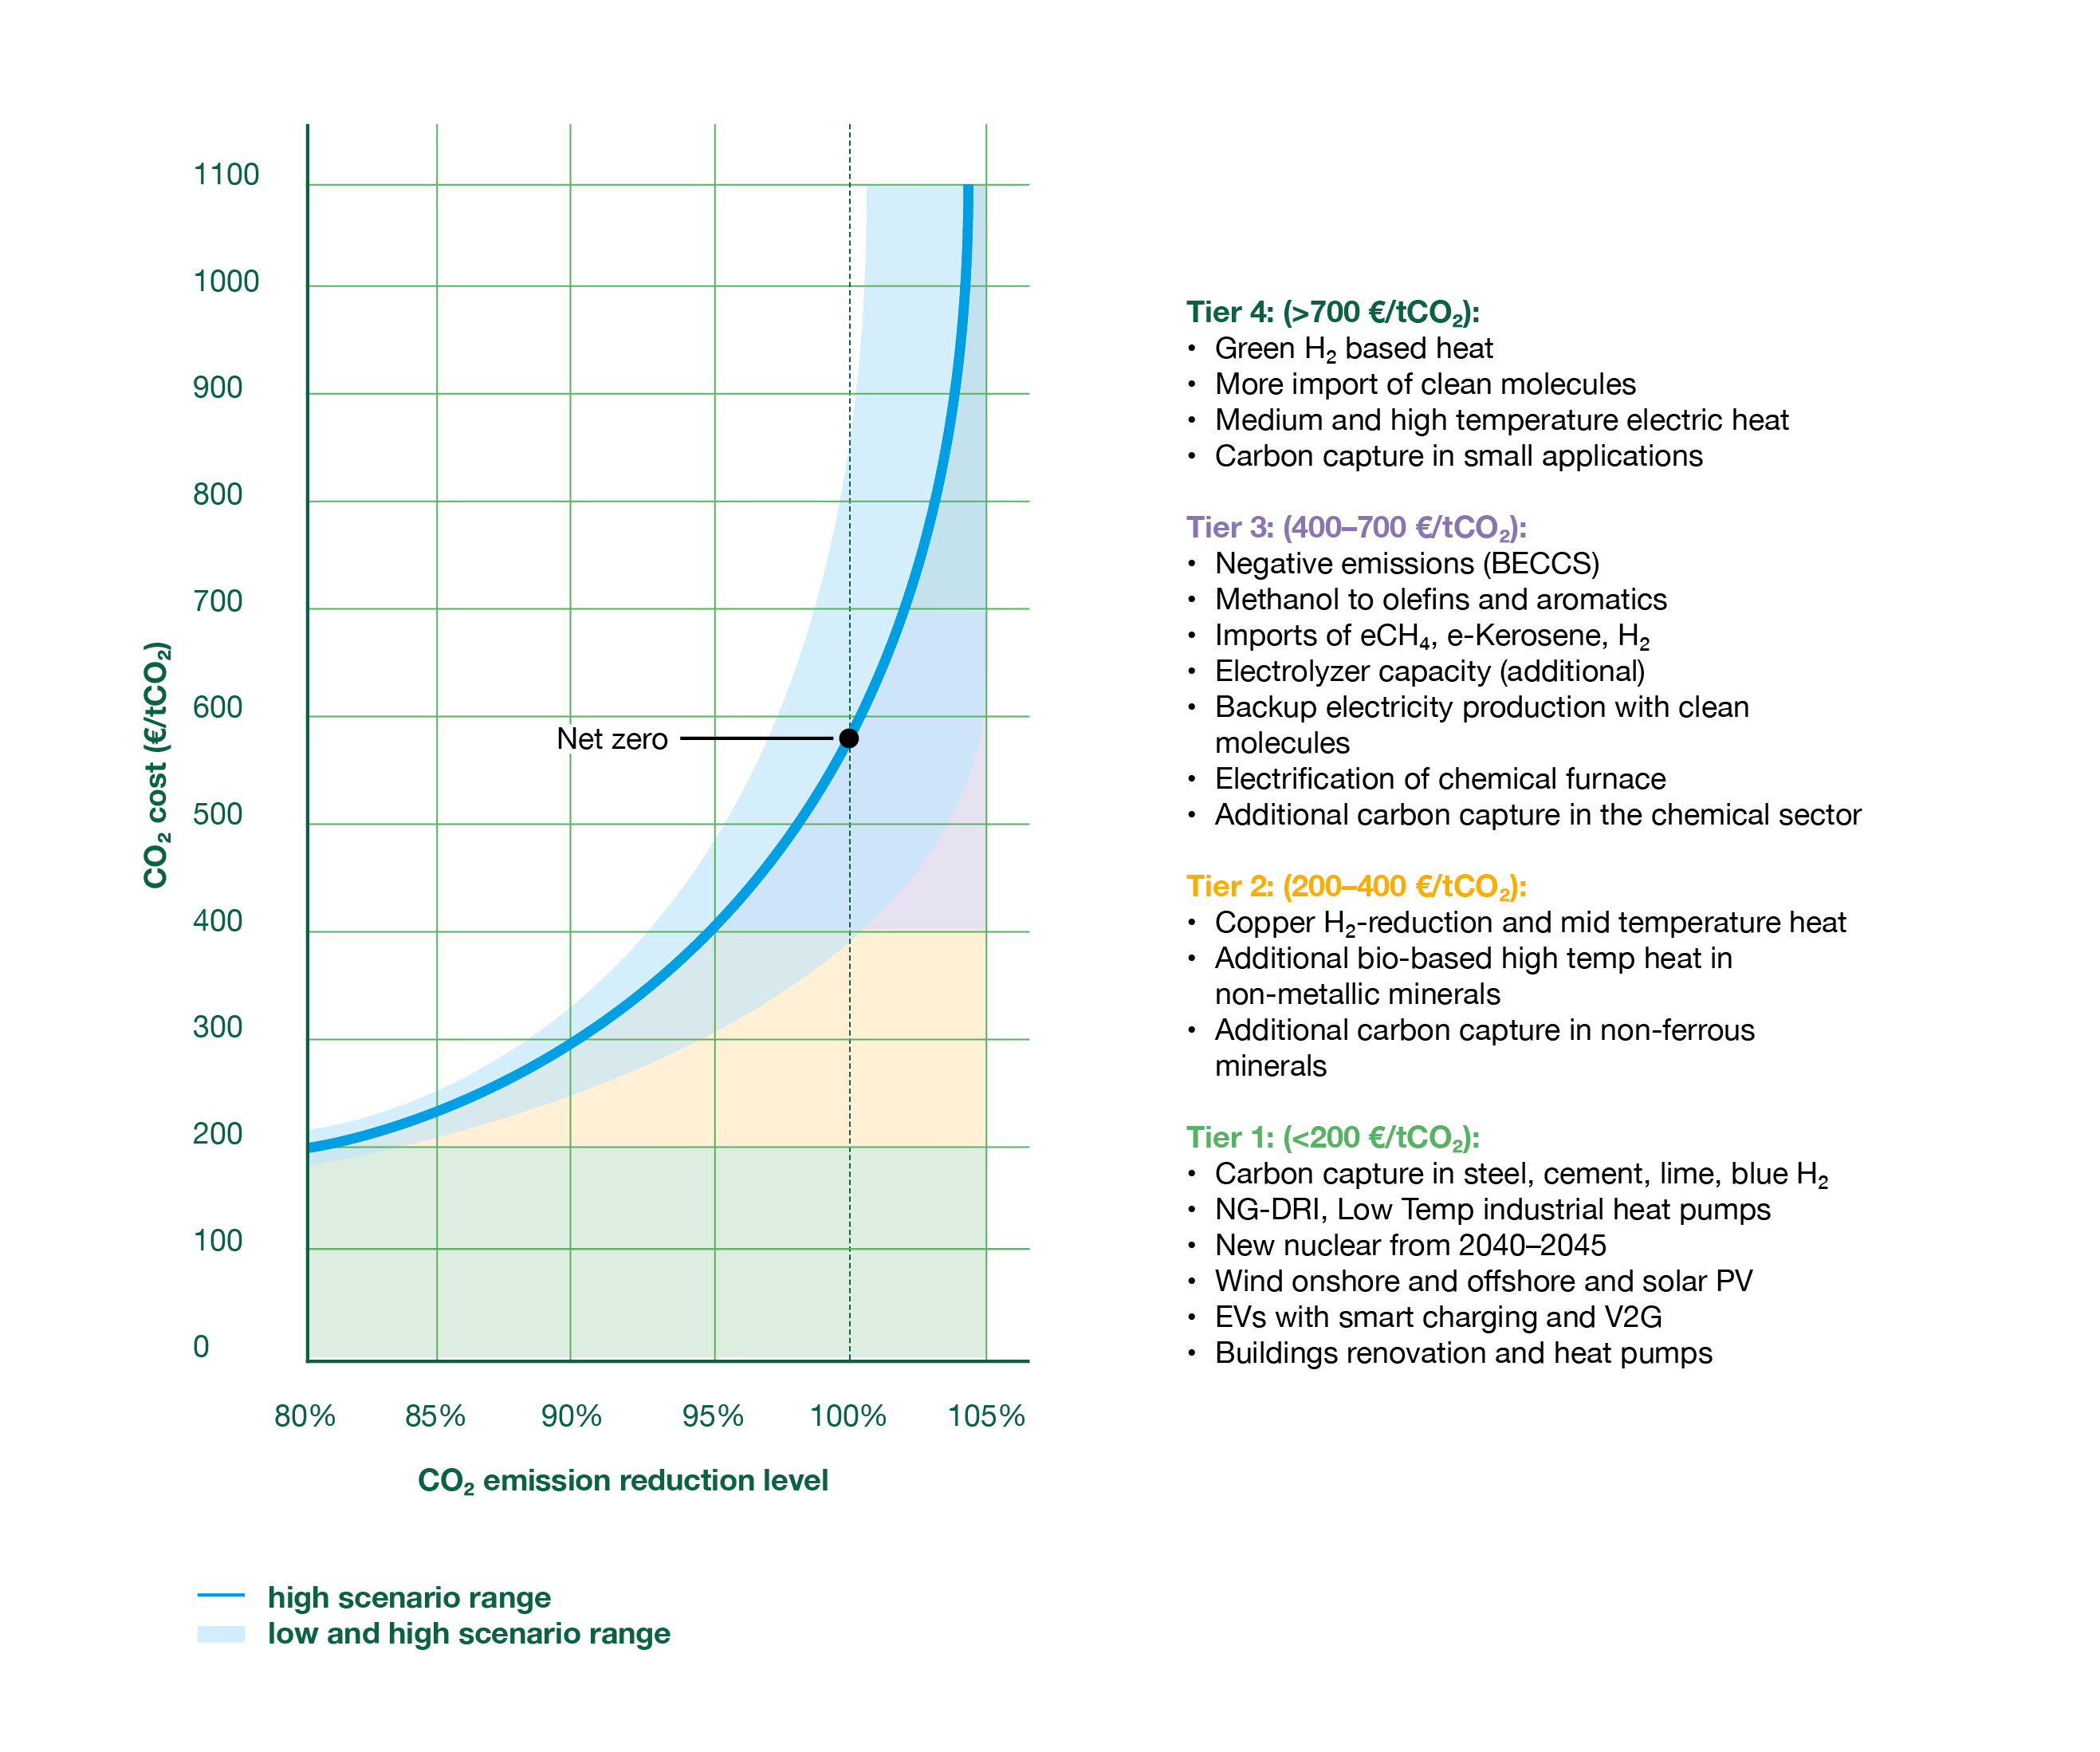
Running the TIMES-BE model under an increasing CO₂ price trajectory to 2050 yields a marginal abatement cost curve (MACC). This MACC quantifies the achievable CO₂ emission reductions at different carbon price levels. In addition, the analysis provides sector-specific abatement potentials and identifies the technologies deployed across varying degrees of decarbonization. In the following graph we have identified 4 Tier abatement levels with an increasing CO₂ price.
The results indicate that an 80% reduction in CO₂ emissions (relative to 1990 levels) can be achieved by 2050 at a marginal carbon price of €200 (2024)/tCO₂. Achieving deeper reductions leads to a more rapid increase in marginal costs: 90% reduction is reached at approximately €300/tCO₂, 95% at €400/tCO₂, and full decarbonization at around €600/tCO₂.
Sectoral reductions at different CO2 prices
The industry and refinery sector exhibit a non-linear emission reduction trajectory similar to the overall system. Emissions can be reduced by almost 90% through a combination of electrification of low-temperature heat, fuel and feedstock switching toward low-carbon molecules, and the deployment of carbon capture and storage (CCS). Achieving net-zero emissions occurs only at higher CO2 prices and reflects two structural dynamics:
First, some residual emissions remain because carbon capture technologies do not capture 100% of process emissions, while full electrification of the remaining processes is either technically infeasible or prohibitively expensive.
Second, negative emissions can be generated in the energy supply sector through the capture and permanent storage of biogenic CO2.
The power sector follows a non-linear decarbonization pathway as well. Cost-effective emission reductions (< €200/tCO2) can be achieved by investments in renewable power, supported by natural gas–fired backup capacity for prolonged periods of low wind and solar output, followed by new nuclear (when allowed, depending on the scenario). At deeper decarbonization levels, backup generation increasingly relies on carbon-neutral molecules rather than natural gas, resulting in higher system costs. As electrification progresses across the energy system, the most cost-effective mitigation options are gradually exhausted, while further emission reductions in end-use sectors typically require more extensive electrification.
The road transport sector can almost fully electrify at relatively low cost, compared to other sectors. Only specific segments, particularly long-haul trucking applications, face higher marginal abatement costs due to operational and technological constraints. The buildings sector (residential and commercial) can achieve roughly 80% emission reductions at relatively low CO2 prices, primarily through renovation/efficiency improvements and electrification (heat pumps). Nevertheless, certain subsectors of commercial buildings need increased CO2 pricing to reach similar decarbonization levels.
International transport remains one of the most challenging sectors to decarbonize, with consistently high marginal abatement costs across all scenarios. Substituting fossil fuels in aviation and maritime transport with sustainable alternatives is technologically feasible, but costly. In the current version of the TIMES-BE model, international shipping relies on e-methane (synthetic methane) across all scenarios. E-methane is produced using electricity and CO2 as feedstock, with the CO2 assumed to be captured from the atmosphere through Direct Air Capture (DAC). Because DAC is highly energy-intensive and requires large amounts of low-carbon electricity and heat, this production is assumed to occur outside Belgium. Alternative fuels for maritime transport include ammonia and methanol. For aviation, e-kerosene (synthetic kerosene) is used across all scenarios. Similar to e-methane, it is produced by combining low-carbon hydrogen with captured CO2 through a series of chemical synthesis processes.
A closer look at the technologies
At CO2 prices below €200/tCO2, mature technologies like heat pumps for building and low temperature heat in industry, EVs, wind power, solar PV, battery storage are widely deployed, with expansion continuing toward 2050 as decarbonization efforts intensify. These technology choices can be seen as no-regret measures to realize early and strong emission reductions. New nuclear power is added to the system from 2040-2045 earliest (depending on scenario). Early investments in Carbon Capture and Storage (CCS) for ammonia and cement production can drive further application for steel, lime and blue hydrogen production towards 2040.
Achieving deeper levels of decarbonization requires the adoption of extra technologies that address harder-to-abate emissions. Examples are Direct Reduced Iron (DRI) processes in the steel industry, large scale industrial heat pumps for electrifying industrial heat demand, turbines powered by low-carbon molecules (e.g., hydrogen, synthetic fuels), and the import of ammonia as an energy carrier or hydrogen vector. In the chemical sector, methanol-to-plastics pathways may be an alternative feedstock route, particularly when the deployment potential of CCS is limited (depending on scenario).
In some cases, the use of technologies increases as CO2 prices go up, such as solar PV (leading to higher midday generation peaks), heat electrification and the use of carbon-neutral molecules in industry and power generation. On the other hand, at very high CO2 prices costly technologies are deployed such as electric furnaces in industrial processes and CCS applied to smaller emission sources. Additionally, negative emissions from biomass in the supply sector gain relevance when prices exceed €400/tCO2.
From net-zero CO2 emissions to net-zero greenhouse gas emissions
Non-CO2 emissions are not represented in the TIMES-BE model and are therefore excluded from the scope of this study. Nevertheless, these emissions remain significant, particularly in pathways aiming at stringent net-zero greenhouse gas targets.
At present, approximately 86% of Belgium’s greenhouse gas emissions consist of CO2. Expressed in CO2 equivalents, methane accounts for roughly 8%, nitrous oxide for about 4%, and fluorinated gases (F-gases), mainly from industrial applications, for around 2%. The agricultural sector is the dominant source of non-CO2 emissions, primarily through enteric methane emissions from livestock and nitrous oxide emissions associated with fertiliser use. F-gases are widely used in refrigeration and air-conditioning systems, however, their use is increasingly restricted under EU regulation and has been declining over time. Another important component of climate mitigation relates to Land Use, Land Use Change and Forestry (LULUCF), where current EU trends indicate that existing targets are unlikely to be met without additional measures.
Although non-CO2 emissions are not explicitly analysed in this study, their reduction will be necessary to achieve economy-wide climate neutrality. Several of these emission sources—such as methane from ruminant livestock and nitrous oxide emissions from agricultural soils—are generally considered difficult to abate. Furthermore, the potential for negative emissions through the capture and permanent storage of biogenic CO2 is unlikely to be sufficient to fully offset the current volumes of non-CO2 greenhouse gas emissions.
System cost vs CO2 reduction ambition
The trade-off between decarbonization levels and system cost marks the boundary of optimal compromises, where improving one impacts the other. Figure 2 illustrates that total system costs for the year 2050 (excl. CO2 emission costs) increase with higher decarbonization levels.
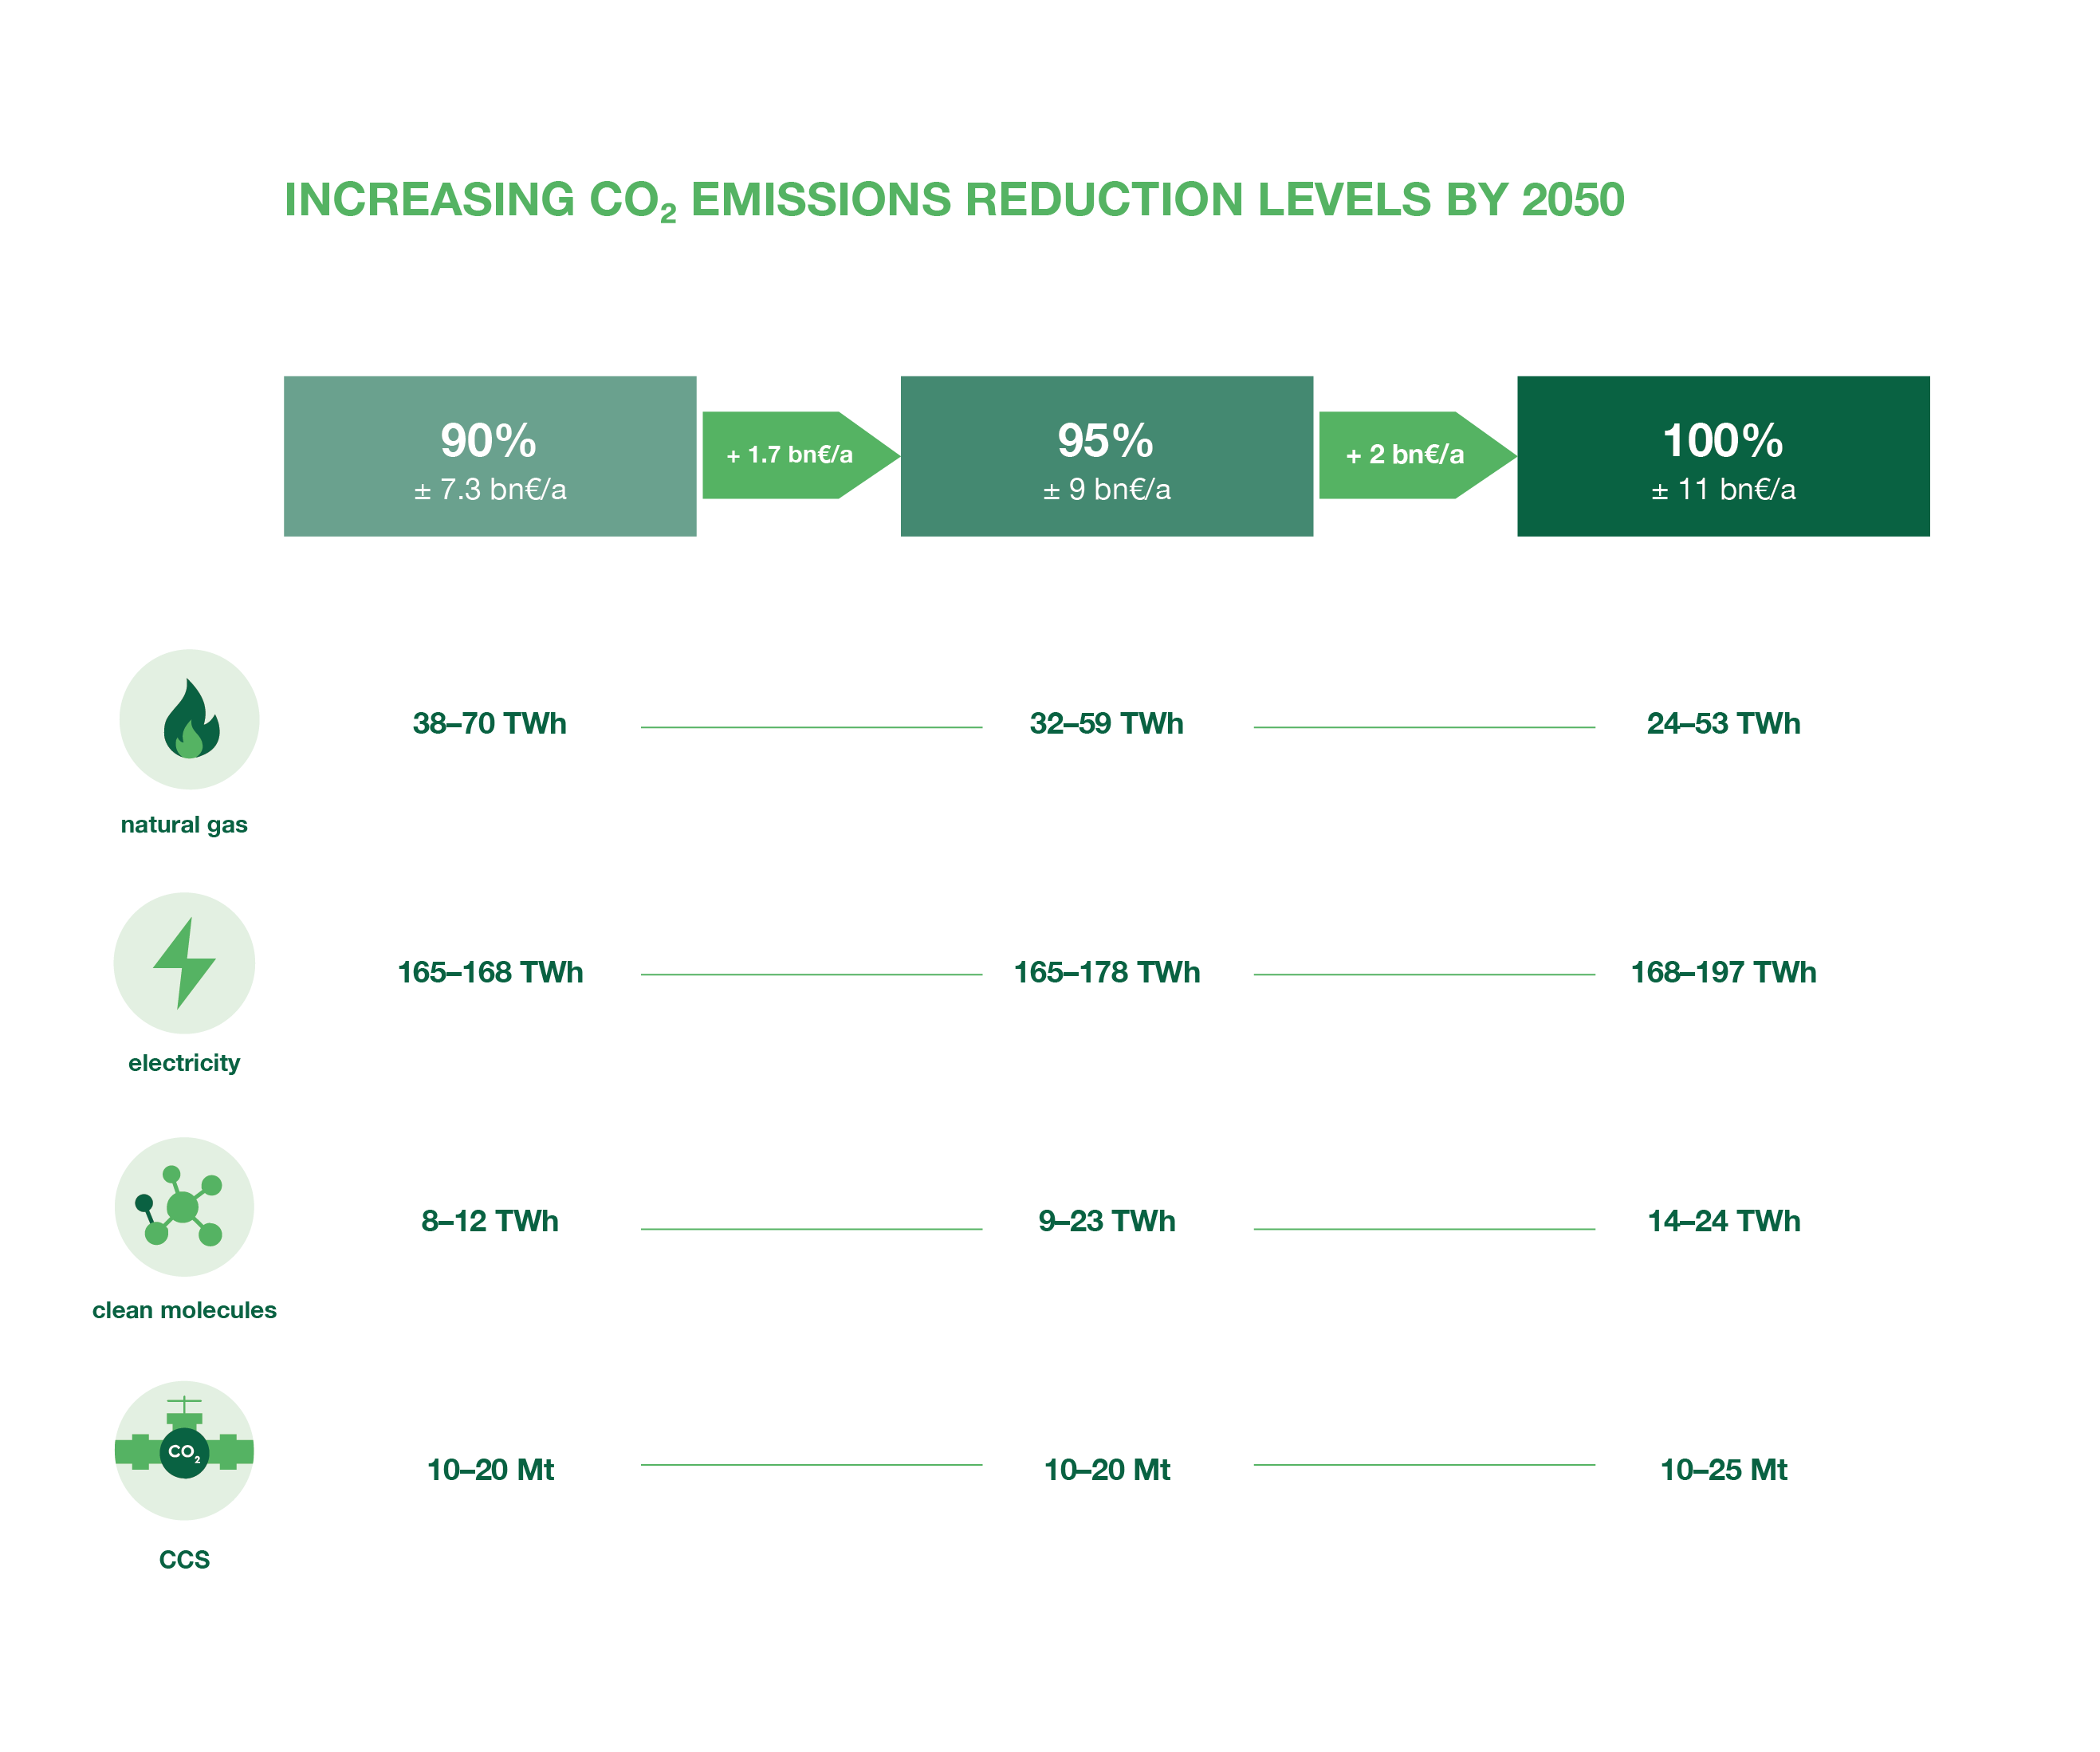
Achieving a 90% emission reduction by 2050 entails additional annual system costs of approximately €7,3 billion, relative to a baseline scenario with a CO2 price reaching €100/tCO2 by 2050 (see Annex for the baseline, lowest CO2 trajectory). The graph shows that implementing a:
95% reduction target can be reached at an additional €1,7 billion per year (average in 2050) in comparison to a 90% reduction case.
net-zero reduction target by 2050 increases system costs by €2 billion per year (average in 2050) in comparison to a 95% reduction case.
The additional system costs associated with more ambitious targets are concentrated mainly after 2045.
Electrification of final energy demand in buildings, transport and industry (excluding some hard to decarbonise processes) is a no-regret measure. The electricity demand already doubles compared to today’s levels when reaching the 90% reduction level, which goes hand in hand with investments in new renewable electricity capacity and nuclear when allowed. With no limitations, depending on the scenario, the use of CCS increases to 20 Mton/a as soon as by 2040. CCS is fully deployed for reaching 90% reduction by 2050.
CO2 emission reductions toward the net-zero goal can be achieved with very stringent, far-reaching reduction technologies, but also by realizing negative emissions. Negative emissions can be accomplished by burning or processing biomass, followed by CO2 capture and storage (CCS). The carbon content in biomass feedstock (e.g., agricultural waste or waste from the paper industry) is captured during its lifetime; hence, storing CO2 after burning or processing effectively removes CO2 from the atmosphere. The potential of this technology is assumed to be limited as biomass is scarce. In addition, we assume that direct air capture (DAC) of CO2 will not be deployed in Belgium. If the technology becomes available at scale by 2050, it could instead be developed in regions with a higher potential for solar and wind energy deployment to fulfil the energy demand of DAC, or with favourable geological conditions to store the CO2.
The level of energy independence constitutes an important dimension of the energy transition, particularly for Belgium, which historically exhibits a high energy dependency index as defined by Eurostat1. Reducing greenhouse gas emissions substantially alters the national energy mix and therefore affects the degree to which the country relies on energy imports. Belgium’s energy dependency was approximately 75%2 in 2024. At about 90% decarbonization by 2050, energy dependency drops to 45%. Increasing CO2 reductions further does not significantly lower import dependency, which reaches 43% at 95% decarbonization and around 40% with a full decarbonization. This limited decline is mostly due to continued imports of carbon-neutral molecules, particularly for international transport, which replace today’s fossil fuel imports. At the same time, the transition to net-zero reduces total energy demand (final and gross energy consumption) through efficiency gains and electrification. As a result, while absolute energy imports decrease further going to net-zero by 2050, the energy dependency stabilizes at about 40%.
In this analysis, far offshore wind outside the Belgian North Sea is not counted as an import, since it is modelled with a direct connection to the Belgian grid. If counted as an import, energy dependency would rise to 44–49%, depending on the scenario. In the IMPORTS scenario, which assumes access to low-cost imported clean molecules, full decarbonization leads to a much higher dependency of 59%. However, these carbon-neutral molecules are expected to be produced in regions with abundant, low-cost renewable energy. As a result, future supplier countries may differ significantly from today’s fossil fuel exporters.
Conclusions and policy recommendations
This deep-dive examines the implications of relaxing the net-zero CO2 target in Belgium, with a focus on system costs, energy import dependency, and technology deployment
A key finding is that the actions that should be taken on the short and medium term remain completely unchanged and are identical to the previous PATHS 2050 scenarios (2025 version). Rapid deployment of renewable energy, electrification of road transport and low-temperature heating, reinforcement of the electricity grid, and the development of CO2 transport infrastructure remain essential priorities. Differences between scenarios mainly emerge after 2045, reflecting differing assumptions of future CO2 price trajectories.
Revisiting the central question “How would introducing greater flexibility mechanisms and carbon markets affect the Belgian energy system and associated costs, rather than strictly adhering to territorial net-zero emissions?”, it becomes evident that relaxing the target from 100% to 95% CO2 emission reductions reduces annual system costs in Belgium by approximately €1,7 billion. Further analysis is required to assess to what extend flexibility mechanisms and carbon markets can offset the remaining emissions at costs below this €1,7 billion per year range.
Beyond achieving CO2 reduction targets, a 90% emission reduction by 2050 decreases Belgium’s energy import dependency from 75% in 2024 to 45%, further declining to 40% under a net-zero scenario. This reduces exposure to fossil energy price volatility.
A sectoral analysis leads to several policy-relevant insights:
- Electrification of transport and buildings should be accelerated, as these sectors provide the largest emission reduction potential at relatively low societal cost. Electrification also offers additional benefits, such as reduced energy import dependency and improved air quality. This transition must be supported by large-scale deployment of low-carbon electricity production (RES and nuclear).
- In the power sector, achieving net-zero emissions in electricity generation as early as 2040 is unlikely to be cost-optimal. Decarbonising gas-fired power plants - operating mainly as backup - should not be prioritised, as it is costly, could increase electricity system costs, and may delay the electrification of demand sectors. However, accelerating investments in renewable capacity must go hand in hand with the increasing electrification of demand sectors. New nuclear capacity will only become available from 2040-2045 earliest (depending on the scenario).
- Carbon Capture and Storage (CCS) can secure fast reductions in the ammonia, blue hydrogen, steel and cement sector. Early investments are needed to allow for significant expansion by 2040 and lower the costs per ton of CO2 stored.
- International transport, industry, and refineries exhibit rapidly increasing marginal abatement costs beyond 90% CO2 emission reductions. Achieving net-zero emissions in hard-to-abate sectors will therefore require strong policy intervention: demand-side policies for low-carbon products reducing risks for buyers, support mechanisms for low-carbon power backup, deployment of CCS combined with biogenic CO2 to generate negative emissions, and support for further research on sustainable fuel production for international transport.
- Moving from net-zero CO2 to net-zero greenhouse gas emissions will require substantial technological breakthroughs in the agricultural sector, where several emission sources remain difficult to mitigate.
Footnotes
1 The energy dependency rate shows the proportion of energy that an economy must import. https://ec.europa.eu/eurostat/statistics-explained/index.php?title=Glossary:Energy_dependency_rate. The formula is constructed as follows. ED = ((IMP − EXP) / (MIN + IMP − EXP)), where IMP= Imported energy, EXP= exported energy, MIN= (Primary production + recovered & recycled products), which includes nuclear heat and renewable production. The denominator expresses the ‘Gross inland energy consumption’ and includes international navigation and aviation.
2 Energy imports dependency, EUROSTAT 2024. https://doi.org/10.2908/NRG_IND_ID
Annex methodology
The three PATHS scenarios ROTORS, REACTORS, and IMPORTS are modelled as in the study in 2025, with the difference that the net-zero target by 2050 is removed and the assumed CO2 price trajectory changes for each case. Thus, resulting in different decarbonization levels driven solely by CO2 prices while the rest of the system and assumptions remain unchanged.
Some important remarks and differences with respect to the 2025 version:
In this study, negative emissions are enabled, which means that the model can invest in negative emission technology and get compensate emissions in other sectors obtaining a net-zero effect in the atmosphere. Negative emissions can be achieved through biogenic processes of which the CO2 emissions are captured and stored. As the biogenic process (e.g. agriculture waste or paper industry waste) takes CO2 out of the atmosphere during its lifetime, storing the CO2 under the seabed effectively reduces the CO2 concentration in the atmosphere. Direct Air Capture is not enabled in the model. As this process requires a lot of electricity and heat and is still at a low technology readiness level, it is assumed that such negative emission technologies will not be deployed in Belgium.
For the steel sector, investment in natural gas direct reduction in combination with CCS was assumed to be fixed in the model in line with Arcelor Mittal’s announced plans.
The system cost is quantified as a function of climate target and scenario, which is an extension to previous work. In previous work, a remainder of 2Mton emissions in Belgium was assumed in the model, which could be compensated by biogenic CO2 capture and storage.