
Wind Delay

Offshore wind delays and energy systemwide consequences
Introduction
Belgium’s wind sector has been built on a strong historical expansion and currently has a substantial wind-energy base. In 2024, wind generation share was 19% with wind offshore providing 10% of the net electricity generation. The federal government has approved state‐aid and support schemes for offshore wind farms. In June 2025, the federal government confirmed that the construction of the artificial island (Princess Elisabeth Energy Island) and the AC infrastructure for future offshore wind will proceed as planned (2.1 GW HVAC), even though the DC part was paused due to an exceptional increase in its cost.
System-level PATHS analyses1 indicated that keeping offshore wind deployment broadly on schedule reduces overall system costs and price pressure in the Belgian power system under the PATHS2050 assumptions. Across the three main scenarios of the PATHS2050 (2025 edition), earlier investments in offshore wind generation capacity mainly limits the need for gas-fired generation and imports during the 2030’s, generally avoiding CO2 costs and lowering the average wholesale prices, thereby facilitating higher levels of electrification. By 2030, in the ROTORS scenario, the optimal electricity supply mix includes the deployment of up to 5.8 GW Belgian offshore wind, reflecting the upper bound identified, among other sources, in Elia’s Blueprint study2. This matches the targets of the Belgian authorities that foresees to double electricity generation from Belgian offshore wind from 8 to 16 TWh, as formulated in the draft NECP (version of the Conciliation Committee of 22 November 2023). Next to Belgian offshore wind, the PATHS2050 scenarios also assumed potential access to an additional 1.5 - 3.5 GW of far-offshore capacity in the North Sea by 2030.
PATHS2050 analysis indicates that delays in Belgian offshore wind development as well as in plans for supra-national offshore projects in the North Sea can materially affect Belgian market outcomes, while a range of factors is currently slowing down development. In recent historical years, wind has surpassed natural gas in Belgium’s electricity mix, yet the scenarios analyzed here show that this balance may shift again towards gas by 2030-2035 if offshore wind deployment lags. The latest submitted version of the Belgian NECP (October 2025) reduces the ambition for Belgian offshore wind generation to 8 TWh in 2030, effectively maintaining today’s level.
This document assesses the impact of offshore wind delays primarily relative to the ROTORS scenario of the PATHS2050 2025 edition. All findings and conclusions should be interpreted in this context.
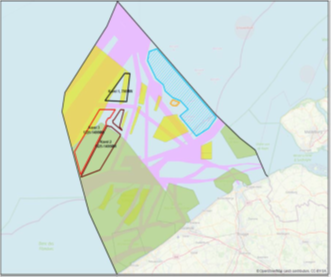
Figure 1: Belgian offshore wind zones and subdivision within the Princess Elisabeth Zone (lots PEZ I, PEZ II, and PEZ III). The existing eastern energy zone is shown in blue shading. The total capacity of all zones is 5.8 GW 3.
Color code: Marine nature protection areas are indicated in green, sand extraction areas and search zones for sand extraction in yellow, and shipping routes in purple.
Introduction
Belgium’s wind sector has been built on a strong historical expansion and currently has a substantial wind-energy base. In 2024, wind generation share was 19% with wind offshore providing 10% of the net electricity generation. The federal government has approved state‐aid and support schemes for offshore wind farms. In June 2025, the federal government confirmed that the construction of the artificial island (Princess Elisabeth Energy Island) and the AC infrastructure for future offshore wind will proceed as planned (2.1 GW HVAC), even though the DC part was paused due to an exceptional increase in its cost.
System-level PATHS analyses1 indicated that keeping offshore wind deployment broadly on schedule reduces overall system costs and price pressure in the Belgian power system under the PATHS2050 assumptions. Across the three main scenarios of the PATHS2050 (2025 edition), earlier investments in offshore wind generation capacity mainly limits the need for gas-fired generation and imports during the 2030’s, generally avoiding CO2 costs and lowering the average wholesale prices, thereby facilitating higher levels of electrification. By 2030, in the ROTORS scenario, the optimal electricity supply mix includes the deployment of up to 5.8 GW Belgian offshore wind, reflecting the upper bound identified, among other sources, in Elia’s Blueprint study2. This matches the targets of the Belgian authorities that foresees to double electricity generation from Belgian offshore wind from 8 to 16 TWh, as formulated in the draft NECP (version of the Conciliation Committee of 22 November 2023). Next to Belgian offshore wind, the PATHS2050 scenarios also assumed potential access to an additional 1.5 - 3.5 GW of far-offshore capacity in the North Sea by 2030.
PATHS2050 analysis indicates that delays in Belgian offshore wind development as well as in plans for supra-national offshore projects in the North Sea can materially affect Belgian market outcomes, while a range of factors is currently slowing down development. In recent historical years, wind has surpassed natural gas in Belgium’s electricity mix, yet the scenarios analyzed here show that this balance may shift again towards gas by 2030-2035 if offshore wind deployment lags. The latest submitted version of the Belgian NECP (October 2025) reduces the ambition for Belgian offshore wind generation to 8 TWh in 2030, effectively maintaining today’s level.
This document assesses the impact of offshore wind delays primarily relative to the ROTORS scenario of the PATHS2050 2025 edition. All findings and conclusions should be interpreted in this context.
Figure 1: Belgian offshore wind zones and subdivision within the Princess Elisabeth Zone (lots PEZ I, PEZ II, and PEZ III). The existing eastern energy zone is shown in blue shading. The total capacity of all zones is 5.8 GW 3.
Color code: Marine nature protection areas are indicated in green, sand extraction areas and search zones for sand extraction in yellow, and shipping routes in purple.
Key questions
These delays could significantly affect the country’s energy transition, raising key questions: how will reduced offshore wind capacity in 2030 and beyond affect the electricity and wider energy system? Which alternative generation capacity or import can compensate for lower wind availability in 2030 and later? Will the electrification rate of the demand sectors be impacted? Focusing on the next 10 years, what is the impact on Belgium’s targets, GHG emissions, system costs and electricity prices?
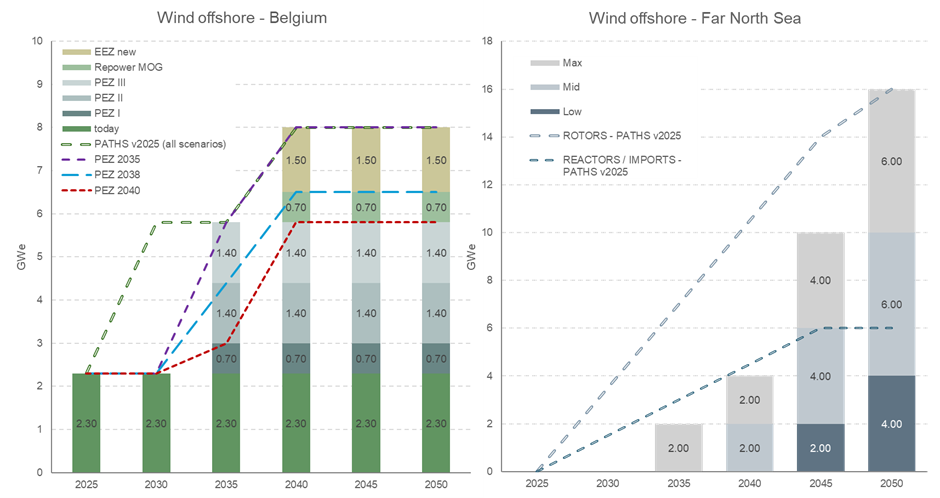
Figure 2. Belgian 4 (left) and supranational (right) North Sea offshore wind capacity deployment
What delay and what is causing it?
By 2030, Belgian offshore wind capacity is projected to be 3.5 GW lower than previously planned5 and as was presented in the PATHS2050 ROTORS scenario. While earlier scenarios assumed 5.8 GW of Belgian offshore wind by 2030, the draft scenarios for the 10-year Federal Development Plans for the electricity and hydrogen networks6 foresee only 4.4 GW by 2035, with completion of 5.8 GW pushed beyond 2035. This implies at least a five-year delay. Moreover, rising connection costs and dependencies with other infrastructure projects also threaten Belgium’s ability to connect to supra-national North Sea offshore projects, creating an additional gap of up to 3.5 GW in non-domestic offshore capacity relative to the PATHS2050 outlook (2025 edition). Permitting, infrastructure grid connection and cost inflation are cited7 as major bottlenecks. The following elements are also involved:
• The offshore wind tender8 for 700 MW in PEZ I has been postponed. The new procedure is expected to be launched by the end of Q1 20269 , marking a delay of nearly 1.5 years.
• Inland transmission network connections (Ventilus and Boucle du Hainaut) are essential (among others) for integrating new offshore capacity. Ventilus is scheduled for 2029-203010 and Boucle du Hainaut for 2032-2033. Ventilus is planned to be ready to connect wind turbines from PEZ I. However, both inland connections are necessary to bring additional capacity ashore from PEZ II and III and to enable integration with the planned North Sea HVDC network. So, any delay of Boucle du Hainaut directly limits offshore expansion beyond PEZ I.
• The Belgian government decided to pause11 the DC part of the Princess Elisabeth island project, and Elia Transmission Belgium (ETB) subsequently postponed signing key HVDC (high voltage direct current) contracts. This decision introduces and estimated 3-year delay for that infrastructure12 .This DC part is required for connecting PEZ III and is not needed for PEZ I and II.
Rationale of the new sensitivities
Several sensitivities were developed to simulate the consequences of delayed offshore wind deployment, both for Belgian and supra-national North Sea wind generation capacity additions. The comparison is made against the ROTORS PATHS2050 reference scenario (2025 edition). Each sensitivity assumes that the HVDC connection (1.4 GW) is eventually approved, but commissioned at different moments, allowing assessment of economic, environmental, and operational impacts for 2025-2035, and the long-term until 2050.
All model assumptions are described a specific section of our PATHS website. Specifically for 2030, the model applies a sector-wide CO₂ price (ETS and non-ETS) of €185 per ton. As in the previous ROTORS scenario, the updated sensitivities are developed under the assumption of a 20-year lifetime extension for Doel 4 and Tihange 3. While a 10-year extension has already been approved and is in effect from 2025 to 2035, extending operation to 20 years remains technically feasible. Achieving this longer extension requires the establishment of a clear, stable regulatory framework.
The table below defines offshore wind delay sensitivities. The year in each new scenario name indicates the year in which the full Princess Elisabeth Zone (PEZ I-III) is operational and fully connected. PEZ 2035 scenarios assume the same 8 GW by 2050 but with a 5-year time lag. PEZ 2038 assumes delays of PEZ III while PEZ2040 reflects a 10-year delay and assumes no repowering. “PEZ2035 + Lag Far Offshore” adds delayed supranational North Sea wind generation capacity.
| Belgian offshore zones [GW] | North Sea offshore grid [GW] | ||||||||||||
| Scenario name | 2025 | 2030 | 2035 | 2040 | 2045 | 2050 | 2025 | 2030 | 2035 | 2040 | 2045 | 2050 | Comment |
| ROTORS 2025 | 2.3 | 5.8 | 5.8 | 8 | 8 | 8 | 0 | 3.5 | 7 | 10 | 14 | 16 | PATHS publication of april 2025 |
| PEZ 2035 | 2.3 | 5.8 | 8 | 8 | 8 | Entire PEZ ready by 2035 (5 yr lag) | |||||||
| PEZ 2038 | 4.4 | 6.5 | 6.5 | 6.5 | + PEZ III delay and no extra zone | ||||||||
| PEZ 2040 | 3 | 5.8 | 5.8 | 5.8 | + PEZ II delay and no repowering | ||||||||
| PEZ 2035 + Lag North Sea offshore grid | 5.8 | 8 | 8 | 8 | 0 | 0 | 2 | 6 | 10 | 5 yr lag for BE + 10 yr for North Sea offshore grid | |||
Key takeaways Belgian wind deployment trajectories
The lag of 5 year in Belgian offshore wind deployment results in approximately 12 TWh less electricity from offshore wind by 2030, which is largely compensated by natural gas generation and electricity imports. By 2035, the renewable generation gap is reduced to zero in the PEZ 2035 sensitivity, while it remains at 3-7 TWh in the other sensitivities, however with a smaller role for replacement by gas-based electricity. Consequently, CO₂ emissions in the Belgian power sector increase by around 2 MtCO₂ in 2030 in all sensitivities, while beyond 2035, the emissions difference becomes smaller (0.5 MtCO2) as the system rebalances.
| Change compared to ROTORS | Unit | PEZ 2035 (5-year lag) | PEZ 2040 (10-year lag) | ||
| 2030 | 2035 | 2030 | 2035 | ||
| Alternative electricity sourcing | |||||
| Natural gas | TWh/yr | +6 | +0.5 | +6 | +2 |
| Imports | TWh/yr | +2.5 | 0 | +2.5 | 0 |
| Solar | TWh/yr | +2.5 | 0 | +2.5 | +2 |
| Emissions | |||||
| Additional CO2 emissions | Mton/yr | +2 | 0 | +2 | +0.5 |
| Cost indicators | |||||
| CO2 pricing costs passed on to end users (the model applies a sector-wide price, ETS and non-ETS) | MEUR/yr | 200-400 | 50 | 200-400 | 250 |
| Energy system cost change | MEUR/yr | Limited | -70 | Limited | -170 |
| Cost for statistical transfer for the 2030 renewables target | MEUR | 100-150 | Not relevant | 100-150 | Not relevant |
| Delivered electricity cost | EUR/MWh | +4-7% | ± 0% | +4-7% | +5-10% |
• When excluding CO2 costs, a lag in Belgian offshore wind has a limited impact on the total energy system costs (or even be slightly lower), as the levelized costs of the alternatives (gas-based power, imports and PV) are comparable to new offshore wind. However, the 2 Mton higher CO2 emissions in 2030 will, at an assumed CO2 price of 90-185 €/ton, lead to a 2-7% increase of the average delivered electricity cost, or an additional €200-400 million in 2030.
Over the full period 2025-2035, higher fossil-based electricity generation raises CO2 emissions totaling 12 MtCO2 cumulatively by 2035. Annual CO2 costs raise by around €250 million on average, though most revenues return13 to Belgium, accumulating to €2-3 billion in additional CO2 pricing costs.
• Impact on the renewable target: Belgium likely has to pay for statistical transfers, if it will be required to close the gap between its NECP projection of 20,4% to its 33% renewable energy contribution14 for 2030. Statistical transfers are a financial mechanism through which a Member State compensates other EU countries with surplus renewable generation, without physically importing electricity. Delays in offshore wind contribute largely to this RES gap: even with accelerated PV deployment, at least 9 TWh more would need to be covered through statistical transfers15, with indicative compliance costs of about €120 million per year16.
• Electricity imports increase by up to 3 TWh in 2030 and 0.3 TWh in 2035, adding €1.4 billion in cumulative import expenses in the period 2025-2035.
• Delays require additional solar PV capacity, around 3 GW (2.5 TWh) by 2030 and up to 2 GW (1.9 TWh) by 2035 in PEZ 2040 to partially offset lost offshore output. Battery deployment remains stable, suggesting limited flexibility requirements.
• Gas-based generation increases by 6 TWh in 2030 (and 1 TWh by 2035) to compensate for missing wind capacity.
• Non-ETS targets remain technically achievable through continued electrification. By 2030, electricity demand remains quite stable with a marginal 0.6 TWh decrease as a result of the lag in wind offshore deployment.
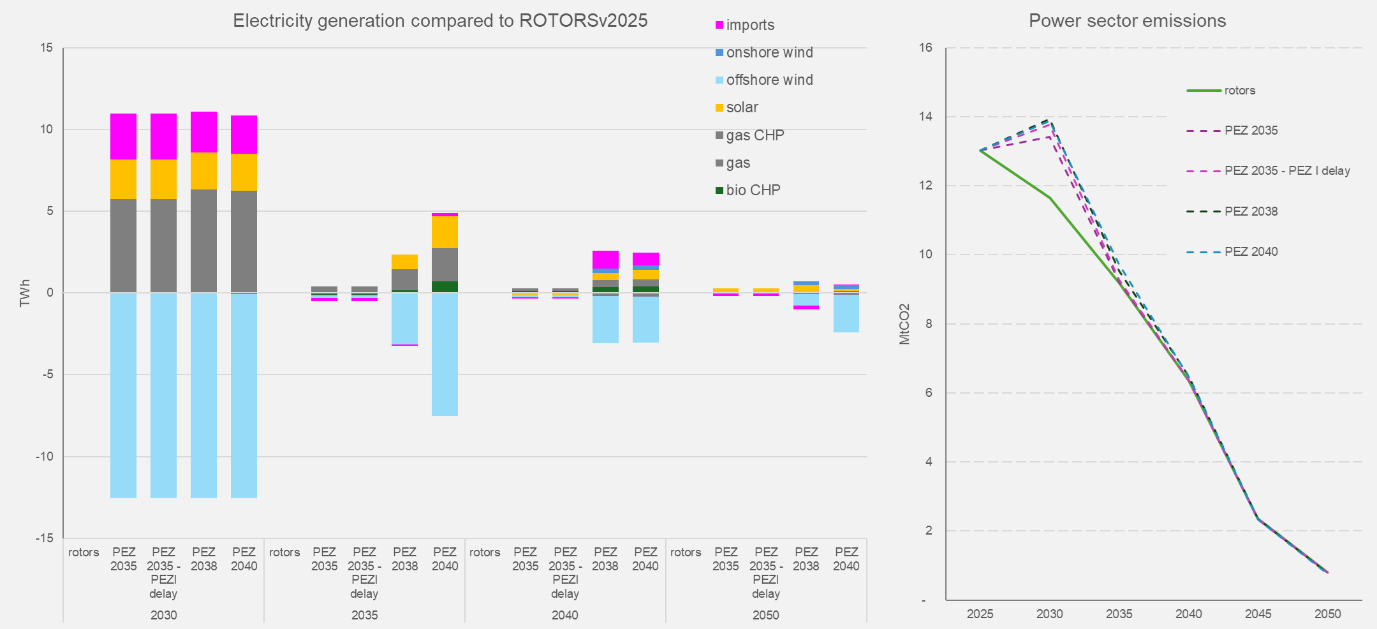
Figure 3. Generation delta in comparison to ROTORS (left) and Power sector CO2 emissions (right).
If the Princess Elisabeth Zone (PEZ) is fully operational only by 2035, Belgian offshore wind capacity in 2030 remains at today’s level of around 2.3 GW. In addition, the delay also implies:
KEY TAKEAWAYS
-
12 TWh
less offshore wind output in 2030, equivalent to 15% of total electricity demand in 2025
-
6 TWh
more gas-fired generation in 2030, plus 2.5 to 3 TWh of additional electricity imports and PV generation each
-
2 Mt
higher power-sector CO₂ emissions in 2030, adding up to around 12 Mt over 2026–2035
-
2–7%
higher electricity bills in 2030, adding around €200-400 million compared to faster wind deployment
-
Around €100 million
per year may be needed to cover the gap towards Belgium’s 2030 renewables target
Key takeaways supra-national North Sea offshore wind trajectories
Even if the full Princess Elisabeth Zone becomes operational by 2035, delayed supra-national North Sea offshore wind projects remain a major risk. Earlier EnergyVille scenarios assumed direct access to 1.5-3.5 GW by 2030 and to up to 7 GW by 2035; current expectations point to little or no capacity by 2035.
In the short and medium term, the missing electricity from supra-national North Sea offshore wind is offset primarily by natural gas generation, while in the long term, the system compensates through higher electricity imports and additional solar PV capacity. Delays in supra-national North Sea offshore connections have a larger impact than delays in Belgian offshore connections. For similar capacity gaps, these projects cause larger electricity shortfalls due to higher capacity factors.
Conclusions and policy recommendations
Impact Belgian offshore
Belgium’s offshore wind strategy is pivotal for achieving climate neutrality, competitiveness and energy security. The current uncertainties around the Princess Elisabeth Energy Island and associated grid projects delay decarbonization, slow electrification and could raise costs. Missing capacity is replaced by gas generation, increasing Belgian CO2 emissions under ETS, and imports. Increased solar PV deployment and promoting flexible resources such as demand response and storage can help offset offshore wind delays. But the decisive limiting factors are grid projects, especially PEZ HVDC, Ventilus, and Boucle du Hainaut. The postponed commissioning of new offshore wind zones especially impacts national targets for renewable energy.
PATHS 2025 highlighted the benefits of rapid large-scale offshore wind deployment, but current developments show clear delays. A five-year delay leads to an electricity cost increase of up to 7% around 2030 compared to the ROTORS scenario with higher wind deployment. This is equivalent to an increase of more than 20% compared to 2025. The price impact is temporary and disappears by 2035 as delayed offshore capacity comes online. A ten-year delay results in a similar cost increase by 2030, but this effect persists until 2035, prolonging pressure on consumers and industry.
Impact supra-national North Sea offshore wind
Current expectations point to little or no supranational North Sea offshore wind generation capacity by 2035. Under assumed CO2 price levels and without connection to a North Sea offshore grid, Belgium becomes more reliant on imports and gas-fired generation. This structurally increases electricity prices by 30% or more compared to today. Avoiding upfront investments reduces short-term costs but risks long-term competitiveness, slowing down electrification. Results show the clear benefits to continue with long-term planning for supra-national North Sea offshore wind connections (like the North Sea Countries signing the Joint Offshore Wind Investment Pact on 26 January 2026), which could involve even highercapacity links and whose system impact exceeds that of Belgian offshore wind. Therefore, timely political and infrastructure decisions are crucial to keep Belgium on a cost-effective and resilient energy transition pathway.
Footnotes
1 https://perspective2050.energyville.be/results/main-edition-2025
4 The capacity deployment 6.5 GW – PEZ III delay is in line with the scenario ‘Local sensitivity’ of the scenario analysis by Elia and Fluxys as inputs to their 10-year Federal Development Plans.
5 Previously, the 2023 draft version of the NECP mentions “it was decided to increase the capacity to be installed in the Princess Elisabeth area (ZPE) to a maximum of 3.5 GW”. Though the timing was unclear, it mentions a doubling of the electricity generation from 8 TWh to 16 TWh. Already in 2021, the Belgian federal government decided to more than double the capacity for offshore wind.
6 Joint Elia and Fluxys work carried out within the Task Force Multi-Energy Scenarios Public Consultation on the scenarios for the 10-year Federal Investment Plans of the Electricity and Hydrogen.
7 Please also read this EnergyVille contribution https://energyville.be/en/blog/choosing-not-to-choose-savings-or-delayed-bill-for-offshore-wind
8 The PEZ project was designed to connect new offshore wind zones (PEZ I–III) in the Belgian Economic Zone, with a planned capacity of 3.5 GW (2.1 GW HVAC and 1.4 GW HVDC). While the HVAC section continues as planned, the HVDC link’s cost has sharply increased, raising doubts about its construction. This decision, still pending political approval, introduces a delay of around 1.4 GW of offshore wind capacity that was expected by 2030.
9 https://economie.fgov.be/en/themes/energy/sources-and-carriers-energy/offshore/organisation-offshore-tenders (consulted on 16/01/2026)
10 After the consultation, the Flemish administration will review all input and the Flemish Government will decide on the environmental permits. Once approved, Elia can start constructing Ventilus, still targeting a start next year and commissioning in 2029–2030. From: Ventilus: public consultation from 8 November to 7 December.
13 The large majority of auction revenues goes to the Member States, source: https://climate.ec.europa.eu/document/download/60672e9d-dee3-4cc1-b93a-ee406a5cf1b3_en?filename=event_20241126_6_1_en.pdf. Still, governments receiving most auction revenues do not compensate the actors who pay the ETS price.
14 Set out in Annex II of the Governance Regulation.
15 Or joined projects.
16 We assume a compliance cost of 13.5 EUR/MWh. Belgium’s 2021 statistical transfer from Finland implied a cost of roughly €18.6 million for 1.38 TWh. In 2020, an agreement of the Netherlands on statistical transfer stipulates that Denmark will transfer a flexible amount of renewable energy to the Netherlands, for a fee of €12.50 per megawatt-hour (MWh). The highest historical statistical transfer was in 2020 amounting to 3.9 TWh according to Eurostat information (nrg_ind_stjpjss).