
Study | Sensitivity Analyses 2025

Background of the sensitivities
The sensitivity scenarios were developed to test the robustness of Belgium’s energy transition pathways under varying technological, economic and policy assumptions. While the main PATHS2050 scenarios, ROTORS, REACTORS, and IMPORTS, define strategic directions toward carbon neutrality, the sensitivities probe how shifts in key variables such as renewable availability, nuclear costs, CO₂ storage capacity and molecule import prices could alter system outcomes.
This document presents an overview of the key sensitivities explored in PATHS2050. The sensitivity runs are based on viewpoints and inputs from the Coalition partners active in PATHS2050 Edition 2025 (VITO/EnergyVille, ArcelorMittal, BASF, Elia, Fluxys and Luminus).
The analysis confirms the robustness of the main scenarios ROTORS, REACTORS and IMPORTS validating the key takeaways. The sensitivity results clarify how each assumption influences total system costs, import dependence and the pace of electrification.
Main Scenario Characteristics of PATHS edition 2025 Scenario Offshore 2050
[GW] Onshore potential
[GW] CCS
Storage
Cap
Extension Doel 4 & Tihange 3 with
20y from 2025 GenIII+ in 2040 New Nuclear
2045+ Molecule prices in 2050
[EUR/MWh] (H2/NH3) Notes ROTORS 8 + 16 20 10 Mton YES NO YES, up to 4 GW 134/136 Max access to wind and SMR in 2045. REACTORS 8 + 6 10 No cap YES YES, 1.6 GW forced YES, up to 8 GW (total of EPR+SMR) 134/136 GenIII+ in 2040 and SMR in 2045. IMPORTS — — No cap NO NO NO 81/82 Import cheaper molecules.
The sensitivity scenarios were developed to test the robustness of Belgium’s energy transition pathways under varying technological, economic and policy assumptions. While the main PATHS2050 scenarios, ROTORS, REACTORS, and IMPORTS, define strategic directions toward carbon neutrality, the sensitivities probe how shifts in key variables such as renewable availability, nuclear costs, CO₂ storage capacity and molecule import prices could alter system outcomes.
This document presents an overview of the key sensitivities explored in PATHS2050. The sensitivity runs are based on viewpoints and inputs from the Coalition partners active in PATHS2050 Edition 2025 (VITO/EnergyVille, ArcelorMittal, BASF, Elia, Fluxys and Luminus).
The analysis confirms the robustness of the main scenarios ROTORS, REACTORS and IMPORTS validating the key takeaways. The sensitivity results clarify how each assumption influences total system costs, import dependence and the pace of electrification.
| Scenario | Offshore 2050 [GW] | Onshore potential [GW] | CCS Storage Cap | Extension Doel 4 & Tihange 3 with 20y from 2025 | GenIII+ in 2040 | New Nuclear 2045+ | Molecule prices in 2050 [EUR/MWh] (H2/NH3) | Notes |
|---|---|---|---|---|---|---|---|---|
| ROTORS | 8 + 16 | 20 | 10 Mton | YES | NO | YES, up to 4 GW | 134/136 | Max access to wind and SMR in 2045. |
| REACTORS | 8 + 6 | 10 | No cap | YES | YES, 1.6 GW forced | YES, up to 8 GW (total of EPR+SMR) | 134/136 | GenIII+ in 2040 and SMR in 2045. |
| IMPORTS | — | — | No cap | NO | NO | NO | 81/82 | Import cheaper molecules. |
Sensitivities overview
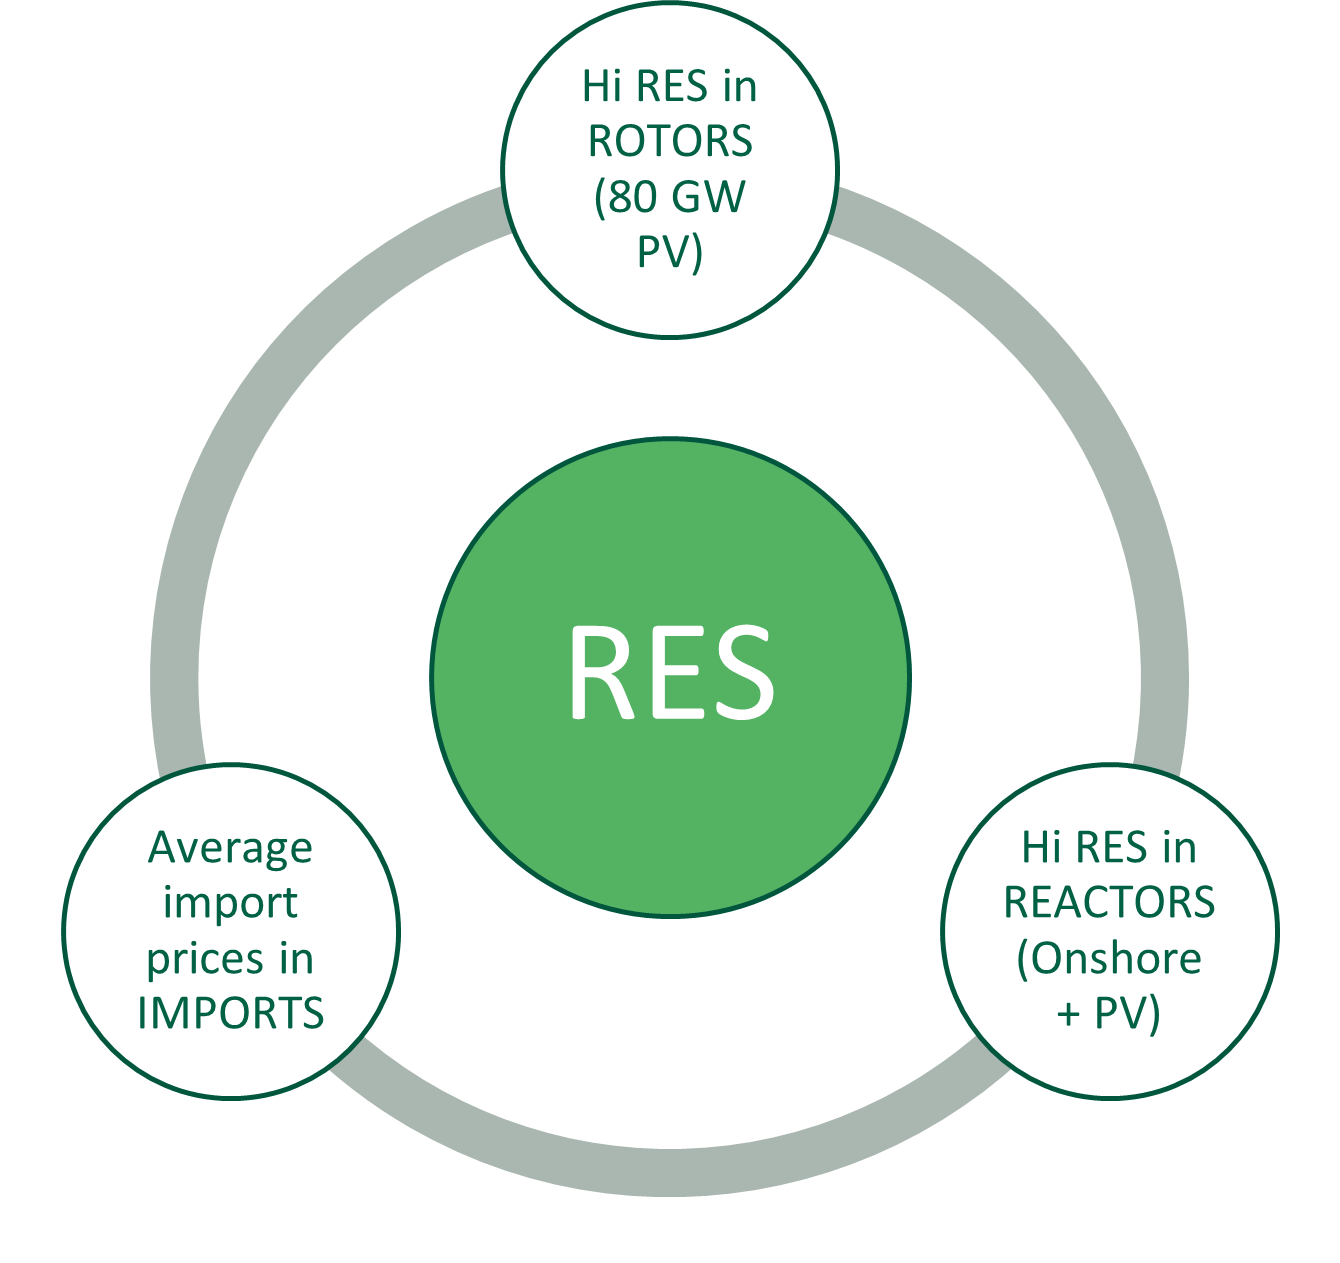
For renewables (RES), sensitivities include the HiRES case with 20 GW onshore wind and 80 GW solar PV enforced by 2050. Another sensitivity relates to the IMPORTS scenario. Here, we examined the impact of applying average molecule import prices, as used in ROTORS and REACTORS, rather than the previously assumed low prices that were based on strong global growth in the hydrogen market.
For nuclear (NUC), sensitivity values range from a low case of 8 kEUR2024/kW to a high case of 15 kEUR2024/kW, including correction for construction time and finance cost. Capital costs for nuclear are specified separately for large Gen III+ plants and SMRs, both representing NOAK (Nth-of-a-Kind) technologies. The reference cost for Gen III+ plants is 11.5 kEUR2024/kW, and for SMRs 10.8 kEUR2024/kW, with the lower SMR cost resulting from their shorter construction time.
For CCS, we have sensitivities on the availability of CO2 storage as well as on the use of electrolyser technology.
Key conclusions for 2050
The conclusions from the main analysis (2025) remain clear: Accelerate electrification and phase out fossil fuels.
According to the developed scenarios and sensitivities, electricity demand doubles reaching up to 170 TWh by 2050, with transport, buildings and industry driving the increase. Fossil fuel use declines sharply: natural gas drops from over 100 TWh today to 21–35 TWh by 2050, largely limited to peak generation and specific industry processes.
Following actions are needed to enable this electrification:
Scale up heat pumps in buildings and electrify nearly all road transport by 2040
Support industry in shifting to electrified processes, especially for low- and medium-temperature heat
KEY TAKEAWAYS
-
Without large-scale offshore and/or nuclear deployment, Belgium cannot meet its future electricity demand and is more dependent on the import of electricity and clean molecules.
-
Belgium should not delay electrification in search of ideal conditions. Varying wind onshore, PV or nuclear assumptions change system costs by 1-2 b€/a, which is less than
15%
of the annual investments needs in the electricity system of ~12 b€/a. -
In scenarios where captured CO2 cannot be exported and can only be used for the production of chemical feedstock,
40 TWh
of clean ammonia or hydrogen are imported as input for CCU processes. -
Clean molecule imports are preferred over domestic hydrogen production from electrolysers.
Clean molecule imports range from
60 to 110 TWh/a
depending on the scenario.
1. Maximise domestic RENEWABLE production while securing imports
In the 3 existing main scenarios, offshore wind (domestic and far offshore) and solar PV expand rapidly, with at least 40 GW of PV and 11–16 GW offshore wind by 2040. Belgium’s 8 GW offshore wind potential is expected to be fully deployed, complemented over time by up to 16 GW of far offshore connections. Solar PV grows steadily, reaching 40–65 GW by 2050, leading to ~1 GW new capacity annually. For this to be realised, short-term system constraints must be addressed to enable the smooth integration of renewables. Belgium remains a net importer of electricity: 7 TWh annually in ROTORS/REACTORS, up to 30+ TWh in IMPORTS. Imports of hydrogen-derived molecules (69–100+ TWh by 2050) are unavoidable to meet aviation and maritime demand.
As illustrated below, the ROTORS and REACTORS scenarios show very similar outcomes in terms of annual system costs by 2050, namely both positioned near the middle. All sensitivity cases remain between the system cost extremes of the IMPORTS scenario (going from IMPORTS with average molecules import prices to IMPORTS with low prices and a version of IMPORTS where nuclear is allowed).
The sensitivity runs bring following additional insights:
Enforcing higher levels of onshore wind and/or PV increases system costs by around 1 b€/a in 2050. While this figure appears high, it remains modest compared to past cost swings and the annual investments of around 12.5 b€ needed in the electricity sector between 2040 and 2050. Domestic renewables, therefore, not only mitigate exposure to volatile fuel prices, but also strengthen energy sovereignty by reducing dependence on energy imports.
With low molecule import prices, the IMPORTS scenario becomes the cheapest option
(-3.3 without nuclear to -4.4 b€/a with nuclear). At average molecule import prices, however, it becomes the most expensive (+5.4 b€/a), underlining Belgium’s dependency on and exposure to global molecule price volatility.Belgium becomes a net exporter of electricity only in sensitivities with large-scale offshore or nuclear deployment combined with high domestic renewable generation. Grid reinforcement and additional storage are needed to efficiently integrate higher volumes of renewables.
Note: The values show the difference in total annual energy system costs in 2050 relative to ROTORS, combining annuitized capital and operational costs.
Disclaimer: All sensitivity cases use the same import price assumptions as ROTORS. The exceptions are three of the four IMPORTS sensitivities, which assume lower molecule-import prices. For these cases, we assume a global expansion of the market for hydrogen and its derivatives, enabling molecule imports at progressively lower costs, reaching 81 €/MWh (equivalent to 2.4 €/kg H₂) by 2050.
2. Decide early on NUCLEAR’s role
 Large-scale deployment of offshore or nuclear energy is critical for electrification and cost reduction. Extending Doel 4 and Tihange 3 by 20 years keeps 2 GW online until 2045. SMRs could add 4–8 GW after 2045, operating flexibly. In the IMPORTS scenario without nuclear, Belgium compensates with more imports and higher PV buildout.
The sensitivity runs bring following additional insights:
From a cost-effectiveness perspective, nuclear electricity competes with offshore wind, though wind is slightly cheaper if more capacity is available. In the main ROTORS scenario, half of the nuclear capacity (2 out of 4 GW) is used to produce up to 16 TWh of hydrogen. In sensitivities with greater far offshore wind availability, this hydrogen production shifts away from nuclear power.
Assumptions regarding nuclear energy affect system costs by approximately ±2 b€/a, a variation that is considerably less significant than the fluctuations resulting from changes in global molecule price assumptions. This range reflects outcomes from the sensitivities: low nuclear CAPEX reduces costs by up to 1.9 b€/a, while in the ROTORS scenario without nuclear availability, higher clean molecule and electricity imports increase costs by 1.9 b€/a. Limiting nuclear capacity reduces domestic electricity generation and electrolyser deployment, resulting in higher imports of both electricity and clean molecules. With high nuclear CAPEX, costs rise only slightly, namely 0.5 to 0.9 b€/a.
Nuclear remains cost-effective with CAPEX up to 15 k€/kW under a social discount rate (3%) and assuming no project delays. In practice, only a few nuclear power plants in the EU have been completed according to their original schedules, highlighting the economic risks of construction overruns. Other large-scale technologies face risks as well, though typically to a lesser extent such as supply chain constraints.
Adding 8 GW of SMRs in the IMPORTS scenario further lowers the system costs with 1 b€/a resulting in a total reduction of 4.4 b€/a.
In conclusion, both nuclear energy and offshore wind play complementary roles in providing low-carbon electricity and reducing import dependence. Nuclear can reduce imports if projects stay on time and within budget.
3. Deploy CCS rapidly in industry as CO₂ storage remains crucial up to 2050
![]() CCS is essential for hard-to-abate sectors (cement, steel, chemicals), capturing up to 20 Mt CO₂ annually by 2040. CCS is not applied to power plants, but is used in the model with biomass in industrial sectors such as steel and cement, where it contributes to achieving negative emissions. The main ROTORS scenario showed that while domestic green hydrogen production remains limited, restricted CO₂ storage can make e-hydrocarbon production economically viable. This is shown in the table, which indicates that 5 Mt out of 15 Mt of CO₂ is used rather than stored.
CCS is essential for hard-to-abate sectors (cement, steel, chemicals), capturing up to 20 Mt CO₂ annually by 2040. CCS is not applied to power plants, but is used in the model with biomass in industrial sectors such as steel and cement, where it contributes to achieving negative emissions. The main ROTORS scenario showed that while domestic green hydrogen production remains limited, restricted CO₂ storage can make e-hydrocarbon production economically viable. This is shown in the table, which indicates that 5 Mt out of 15 Mt of CO₂ is used rather than stored.
The sensitivity runs bring following additional insights:
Removing the 10 Mt/a CO₂ storage limit in ROTORS increases storage to 18.5 Mt/a (only 1 Mt less than REACTORS and IMPORTS). This reduces system costs by about €1.5 b€/a in 2050. In this high-CCS case, greater storage availability lowers the need for clean molecules but also partially displaces electrification.
Conversely, restricting storage to 1 Mt/a in ROTORS raises system costs by around €5 b€/a in 2050. This is mainly due to higher imports of clean molecules and a shift from CO₂ storage to carbon re-use, rather than increased electrolysis, as illustrated in the table below. Most of these additional costs come from importing molecules to combine with captured CO₂ for synthetic feedstocks (e.g. aromatics, olefins). This substitution pushes out cheaper fossil feedstocks, which in the model are not subject to carbon limits. A smaller share of the cost comes from increased hydrogen imports for steel production.
Overall, CCS remains essential for hard-to-abate sectors. If storage is constrained, these sectors are forced into greater reliance on clean molecules and alternative CO₂ use. In the near term, it is therefore essential to establish a clear and supportive regulatory and financial framework to facilitate large-scale deployment of CCS by 2030.
Table: Key results of CCS sensitivities and their link with clean molecules generation and imports
| CO₂ storage | Scenario | CO₂ [Mt/a] | Energy [TWh] | ||||
|---|---|---|---|---|---|---|---|
| Stored | Captured | Used | Domestic | Import | |||
| Electrolysers | H2/NH3 | Other | |||||
| Restricted | ROTORS – standard | 10 | 15 | 5 | 16 | 13 | 56 |
| ROTORS 1 Mt/a | 1 | 12 | 11 | 14 | 53 | 59 | |
| ROTORS Hi-RES | 10 | 15 | 5 | 16 | 13 | 54 | |
| Unrestricted | ROTORS no CCS limit | 19 | 19 | 0 | 10 | 7 | 56 |
| REACTORS | 20 | 20 | 0 | 8 | 8 | 60 | |
| REACTORS HiRES | 19 | 19 | 0 | 13 | 6 | 57 | |
| IMPORTS | 20 | 20 | 0 | 0 | 25 | 77 | |
4. Import clean molecules preferred over domestic hydrogen production from electrolysers
![]() Hydrogen production in Belgium remains limited compared to the much larger expected import of clean molecules. Domestic electrolysis can still play a role, particularly in configurations when a high utilisation rate of the electrolysers is possible (around 7,000 operating hours per year). Optimal electrolyser capacity remains relatively small: about 1 GW in REACTORS and 2 GW in ROTORS. Model results point to off-grid operation as attractive, though this may be partly driven by the way grid congestion is represented in the model.
Hydrogen production in Belgium remains limited compared to the much larger expected import of clean molecules. Domestic electrolysis can still play a role, particularly in configurations when a high utilisation rate of the electrolysers is possible (around 7,000 operating hours per year). Optimal electrolyser capacity remains relatively small: about 1 GW in REACTORS and 2 GW in ROTORS. Model results point to off-grid operation as attractive, though this may be partly driven by the way grid congestion is represented in the model.
The sensitivity runs with various electrolyser technologies bring following additional insights:
High operating temperatures are not essential; lower-temperature options can also be cost-effective. In the initial runs, we expected high-temperature electrolysers to enable domestic hydrogen production, but when this specific technology was removed in the sensitivity analysis, the results remained unchanged.
Cost differences across the sensitivities are minimal. The decisive factor is not temperature, but whether grid costs are applied.
Footnotes
1 Molecule prices are based on the average and low values derived within the PROCURA project. Clean molecules are energy
carriers, such as hydrogen or derived fuels produced exclusively from renewable electricity. Correa-Laguna, J., & Valee, J. (2025). ETF- PROCURA project WP3, final report. EnergyVille - VITO. https://doi.org/10.5281/zenodo.16876277