
Industry sector detail
The EnergyVille TIMES-Be model has been updated and extensively reviewed by industry sector federations and companies. As such, the model consists of detailed sector representations, current production processes and technology options to reach net-zero emissions by 2050.
For each sector, we have identified the following options where technically possible, with the most recent costs and efficiency estimates towards 2050:
- Energy efficiency improvements
- Fuel substitution
- Electrification
- Synthetic molecules (H2 and derivates)
- Carbon Capture Utilisation (CCU) and/or Storage (CC(U)S)
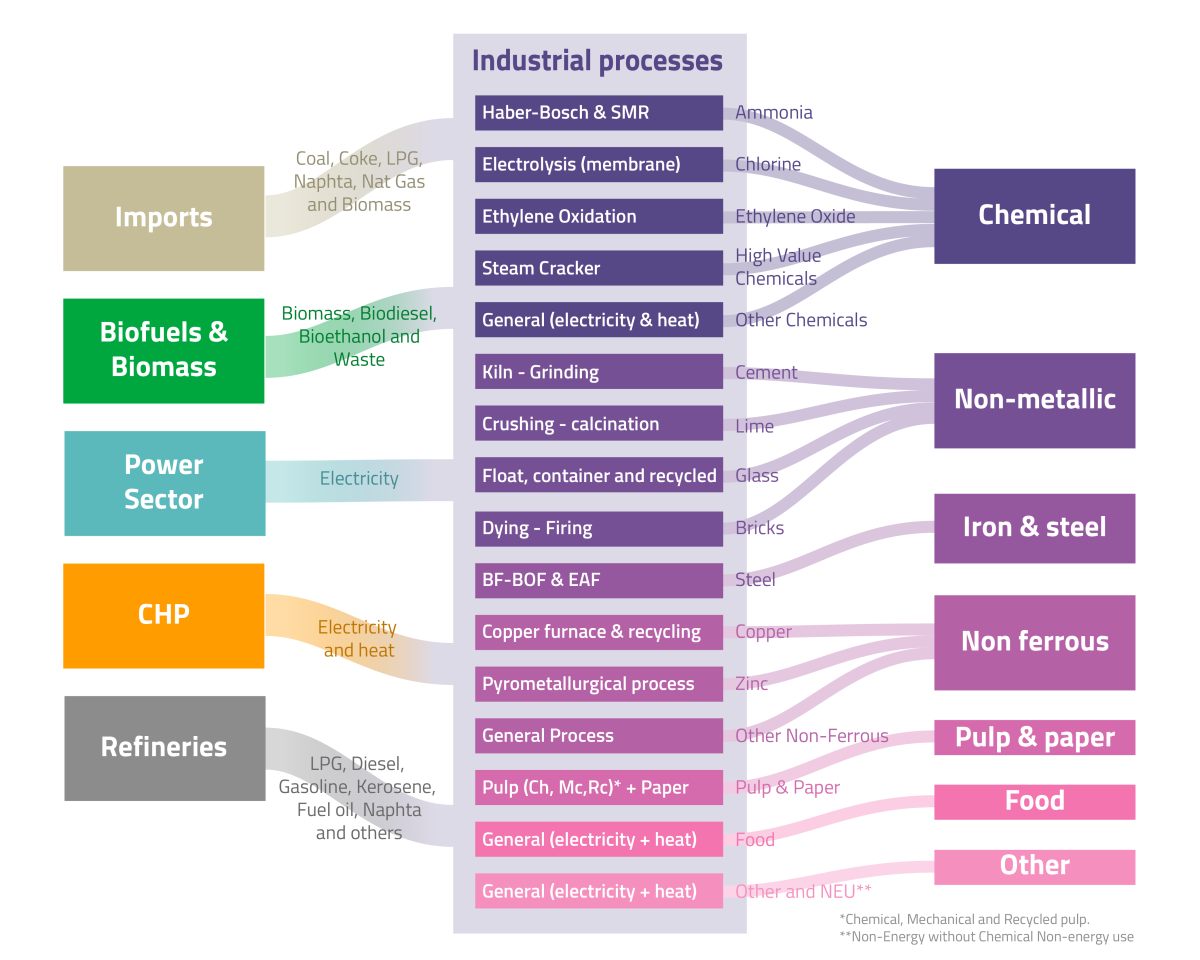
The reference system for industrial processes
Final energy use
In this study, it is assumed that the industrial production levels in Belgium remain constant in all three scenarios. In other words, assessing the risk of industries moving to other parts of the world with more potential for abundant renewable energy production, is not part of this study.
Although the industrial production levels remain constant, the final energy use and mix does change drastically. Fossil fuels remain dominant at least until 2030, with CO2 capture surfacing as the largest means of emission reduction. From 2040 onwards, electrification of processes is crucial. However, compared to other sectors, electrification does not lead to large energy efficiency improvements in the industry. Heat pumps for low temperature heating and electric mobility realise very high efficiency gains – more than a factor 3 compared to the existing fossil technology. High temperature electric processes in the industry – such as electrification of furnaces – do not lead to such large efficiency gains. Electricity demand as input for decentralised electrolysers to produce hydrogen, is reported as electricity.
The role of clean molecules heavily depends on the import price and differs depending on the scenario considered.
For more information on how clean molecules are produced and represented in the TIMES Be model, have a look at the Hydrogen Sector Results page.
- Central scenario:
Final energy use – mainly electricity – already increases by 2030 due to the large energy/process heat demand of the carbon capture process. By 2040, electrification of more processes leads to a 60% higher electricity demand compared to the base year. By 2050, the electricity demand is 2,3 times higher, mainly because of electrification of the steel production, electric furnaces in the crackers of the chemical industry and a more modest increase in the other sectors due to electrification of low temperature heat demand.
The total use of clean molecules increases to 26 TWh by 2050, which is 21% of the total end use: 15 TWh comes from import or centralised production, 11 TWh is produced in the industry (and uses 14 TWh of electricity in its production process). Clean molecules are used for high temperature processes in the chemical industry (58%), glass and bricks (21%), steel finishing and smaller portions in the lime & cement sector. - Electrification scenario:
Having access to more offshore wind and SMR technology increases the electricity demand of the industry only slightly in 2050 (+ 6,5 TWh, which is an increase of 7%) compared to the Central Scenario, and this due to further electrification of the steam crackers in the chemical sector. The use of clean molecules is the same as under the Central Scenario. - Clean Molecules scenario:
As is further discussed below, a limitation on the carbon storage potential to 5 Mton/y leads to a much slower CO2 reduction trajectory, and the final energy use in 2030-2040 decreases because of a lower energy demand for the carbon capture process. Electrification of processes occurs at the same pace as under the Central Scenario, but the uptake of clean molecules already starts in 2030, and increases to more than 16 TWh in 2040.
By 2050, final energy use grows to 148 TWh, which is an increase of 22% compared to the Central Scenario. Due to the limit on carbon capture and storage, more processes switch to electrification and clean molecules. Even more electrification of the steam crackers in the chemical sector occur, but the main difference is the use of more than 37 TWh of clean molecules, of which 27 TWh comes mainly from import, and 10 TWh is produced in the industry. Compared to the Central Scenario, hydrogen is now also used for methanol synthesis as feedstock for a methanol to aromatics/olefins process.
-
Until at least 2030, fossil fuels remaindominant
in the industry as final energy demand.
-
By 2050, electrification of industrial processes leads to an increase ofx 2
the current electricity demand in all scenarios.
-
By 2050, clean molecules amount to21-25 %
of the final energy demand in industry.
-
By 2050, in the Clean Molecules scenario2,5 Mton
of captured CO2 emissions are used for the production of clean methanol as feedstock for methanol to aromatics/olefins processes.
CO2 emissions
- Central scenario:
CO2 emissions decrease from almost 26 Mton today to 8,7 Mton by 2030 – a decrease mainly realised due to 'Carbon Capture & Storage' (CCS) which removes more than 17 Mton/y of carbon emissions. That CCS removes 5,2 Mton/y carbon emissions from iron & steel, 4,7 Mton/y from high value chemicals, 3,8 Mton/y from cement and 1,9 Mton/y from ammonia production. Other sectors with more limited CCS are glass, bricks and ethylene oxide production, where CCS removes a total of 1,7 Mton/y.
CCS increases to 18,5 Mton/y by 2040, and then also occurs in the lime sector.
The net-zero constraint in 2050 cannot be reached with these large volumes of CCS. The captured and stored volume decreases to 7,4 Mton, whereas CCS is still needed for the high value chemicals and typical non-avoidable process emissions in the cement and lime production. As explained in the Final Energy Use paragraph here above, electrification and the use of clean molecules realise the further CO2 reduction. Remaining industrial emissions account for 1,4 Mton/y by 2050. - Electrification scenario:
Although 2 Mton less Carbon Capture & Storage is used because of the higher electrification rate, in general the impact of this scenario on the CO2 reduction trajectory is negligible compared to the Central Scenario. - Clean Molecules scenario:
Under this scenario, the limited access to carbon storage of 5 Mton/y from 2030 onwards, puts a constraint on the CO2 emission trajectory for the industry. Emissions in 2030 are 18,2 Mton – more than double the amount of the Central Scenario emissions. In 2030, only 2,7 Mton/y of emissions are captured and stored in the industry, namely the process emissions in the cement sector. The other 2,3 Mton/y of CCS occurs in the supply sector (refineries). By 2050, in total 7,5 Mton/y are captured, of which 5,4 Mton/y in the industry: mainly in the cement and lime production. Since only 5 Mton/y can be stored, the remaining 2,5 Mton/y are used for methanol synthesis;
-
By 2030, Carbon Capture and Storage (CCS) removes17 Mton
of CO2 emissions from the atmosphere.
-
In 2030, a limited access to commercial carbon storage to 5 Mton leads to10 Mton
higher industry emissions compared to the Central scenario.
-
By 2050, CCS is limited to7,4 Mton
and applied in cement, lime, high value chemicals.
Annual costs
- Central scenario: Due to the optimisation and perfect foresight principle of our TIMES-Be model, the model starts investments in low carbon technologies from 2030 onwards. The sum of the undiscounted, annual depreciation of investments and operational costs for the industry – needed to go from a scenario with a fixed carbon tax of 50 €/ton to a net-zero 2050 future – amounts to:
- 2030: + 0,87 billion euro
- 2040: + 1,08 billion euro
- 2050: + 2,34 billion euro
- Electrification scenario: Compared to the Central Scenario, the electrification of processes occurs at the same pace, but the annualised investment and operational costs for the industry are 0,24 billion euro lower by 2050.
- Clean Molecules scenario: The limited access to carbon storage of 5 Mton/y from 2030 onwards, puts a constraint on the CO2 emission reduction trajectory for the industry. CO2 reductions are achieved at a slower pace, leading to lower costs in 2030 and 2040 compared to the Central Scenario. However, in 2050, the lower costs of clean molecules do not outweigh the limited access to carbon storage. Achieving net-zero under this scenario leads to a slightly higher annual cost for the industry: 2,41 billion euro